(Part IV) The Epic Conclusion of SHOW ME YOUR BUDGET: A Multi-Part Series on Great Nonprofit Budgets

This is the fourth and final post in a series about creating and utilizing a great program-centered budget.  Click here to read Part I: Choosing to Create a Program-Centered Budget.  Click here to read Part II:  Choosing the Right Revenue and Expense Lines (and Naming Them Well). Click here to read Part III: Allocating Shared Cost.

Introduction

“Don’t tell me what you value; show me your budget, and I’ll tell you what you value.”

A nonprofit’s annual budget has the capacity to be the most important communication tool the organization has – both internally and externally.  A clear and purposeful budget can simultaneously provide trustees and staff the insights and understanding they need make mission-driven strategic decisions and inspire donors, program partners, and other constituents to engage with the organization.  

A great budget tells a story about what we value – every bit as much as a great speech, brochure, website, or solicitation.  When we develop a budget, it’s our obligation, and a great opportunity, to tell that story intentionally and directly – and (importantly) in a way that doesn’t make most readers feel like they’re reading a foreign language.  I believe that the most compelling and effective way to do just that is through a “Program-Centered Budget.” 

* * * * *

Part IV: Presenting Our Program-Centered Budget

The Full Budget

Taking as a given that we’ve categorized and named our revenue and expense lines to reflect what we value and what we want external and internal constituents to understand (as explored in Part II of this series), here is a sample of what a what a summary program-centered budget looks like.

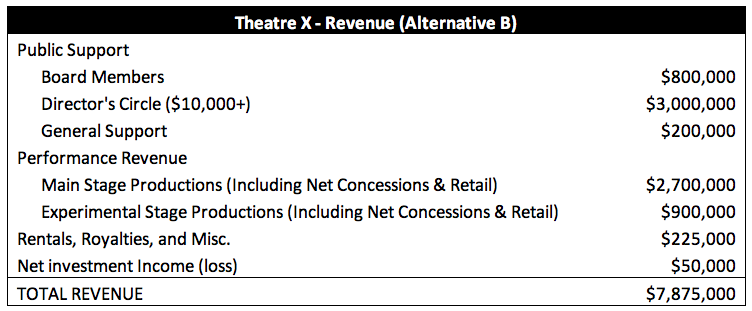
Even people who don’t spend a lot of time with financial statements should be able to look at this budget and easily understand 1) where funding comes from, and 2) how funds are invested to accomplish the organization’s mission.  In addition to offering a straight-forward budget in “table” format, our organization of the budget also lends itself well to graphics to tell our story.  For example, an easy way to convey where our funding comes from would be…

96


Normal
0


false
false
false

EN-US
X-NONE
X-NONE


 <w:LatentStyles DefLockedState="false" DefUnhideWhenUsed="false"
DefSemiHidden="false" DefQFormat="false" DefPriority="99"
LatentStyleCount…


The visual makes it very clear: a little more than half our funding comes from public support (contributions), a little less than half comes from performance revenue (subscriptions, tickets, and on-site retail), and a small sliver comes from other sources.  Depending on the purpose and audience of our graphic, we could create additional or different graphics to further break down sources of public support or performance revenue.  But this simple graphic, coupled with the full budget, tells a clear story about our revenue.

What Graphics of the Other Budget Types Expenses Would Look Like (The Ones We Do Not Want)

On the expense side, looking at graphic representations underlines why a program-centered budget is the best approach.  So let’s take a quick look at what our pie charts would look like with the other two budget types.  


The graphic above reinforces what we discussed in Part I about why a functional budget is of almost no value to board members and other internal constituents, and even less to donors and other external stakeholders.  

96
 
Normal
0


false
false
false

EN-US
X-NONE
X-NONE


<w:LatentStyles DefLockedState="false" DefUnhideWhenUsed="false"
DefSemiHidden="false" DefQFormat="false" DefPriority="99"
LatentStyleCount="381">
…


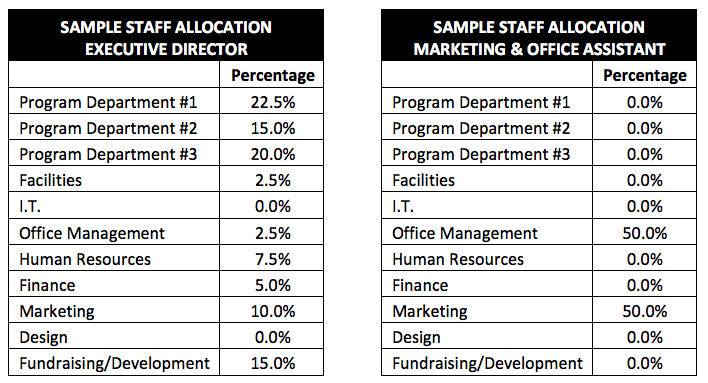
As we’ve discussed, a departmental budget is a frequently-used approach to budgeting.  But when you look at it as a graphic, it shows itself to be even worse than a functional budget, in many ways.  The functional budget chart is mostly just useless and confusing to see as a chart.  But for the departmental budget, because shared expenses have not been allocated to the programs that are sharing them, the chart is actually very misleading.  Looking at this graphic, you might reasonably come to the conclusion that the organization spends about half of its budget on its three programs combined (in green, on the left of the chart) – and that a whopping 48% of the budget is spent on activities other than the programs the organization exists to offer.  This, of course, is not the case – and presenting the numbers that way to internal and external stakeholders does everyone a great disservice.

Expenses Chart – Standard Representation of Program-Centered Budget Expenses

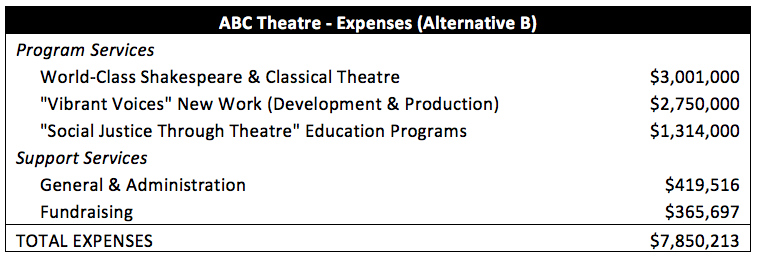
In a program-centered budget, shared expenses are accurately allocated to the programs that share them, so our expense lines are the programs we offer, fundraising expenses, and unallocated general and administrative expenses.  This offers readers a clear and accurate picture of how funds are invested.  Going back to Theatre ABC and our budget above, a standard program-centered pie-chart would look like this:

96
 
Normal
0


false
false
false

EN-US
X-NONE
X-NONE


<w:LatentStyles DefLockedState="false" DefUnhideWhenUsed="false"
DefSemiHidden="false" DefQFormat="false" DefPriority="99"
LatentStyleCount="381">
…


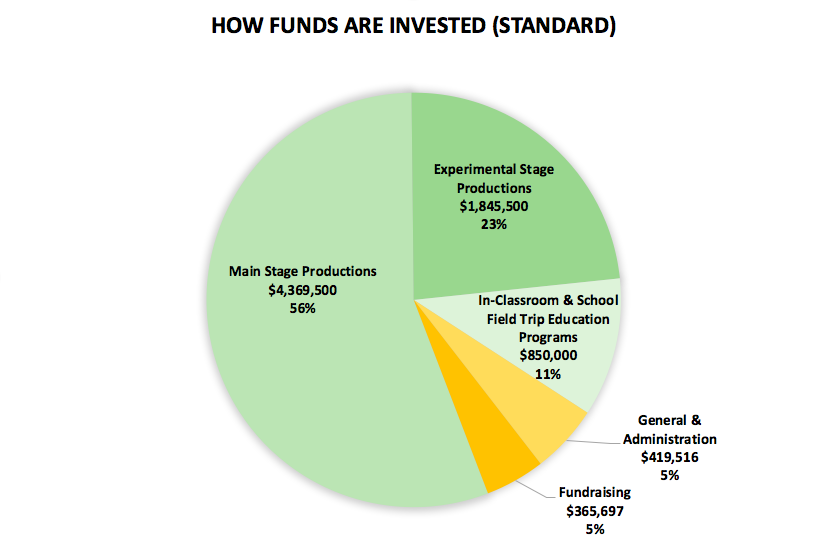
This chart is tells our story more accurately and more clearly than the charts for functional and departmental budgets. 

Expenses – An IMPROVED Representation of Program-Centered Budget Expenses

In terms of presentation, we can could stop with the program-centered budget table, revenue chart, and expense chart and have a meaningful and effective set of communications tools.  That said, I’d like to share a way that we can make our expense graphic even more effective.  In a recent an article in The Nonprofit Quarterly magazine, Curtis Clotz, of the Nonprofit Assistance Fund, suggests that we categorize fundraising and G&A together as “Core Mission Support.”  (You may recall that, in Part II of this series, I grouped fundraising and G&A as “Support Services,” as I’ve always thought it was important to make clear that both existed to make our core programs possible – not as costs in a vacuum that take away from our programs.  But I like Mr. Clotz’s “Core Mission Support” even better, and have changed the category name in the budget and graphics above. 

In the article, Clotz articulately calls out the central drawback of the standard program-centered expense pie-chart:

“When nonprofits are viewed this way, no matter how hard we try to think differently, we imagine important infrastructure of our organization as taking a slice out of the pie—as diminishing the “real” work of our mission.  Strategic financial functions, good governance, and the development of key funding partnerships are vital to strong organizations. We need a new way to communicate this truth.”  He goes on to suggest that this core mission support could be presented in the center of the pie, “rather than thinking of our investment in key infrastructure as diminishing our programs.”

This idea of literally placing Core Mission Support at the core of our budgets is both elegant and exciting.  Incorporating the idea into a graphic that can be used to effectively communicate specific budget figures, the improved pie chart could look something like this:

The graphic representation of our budget now conveys two different important messages:  

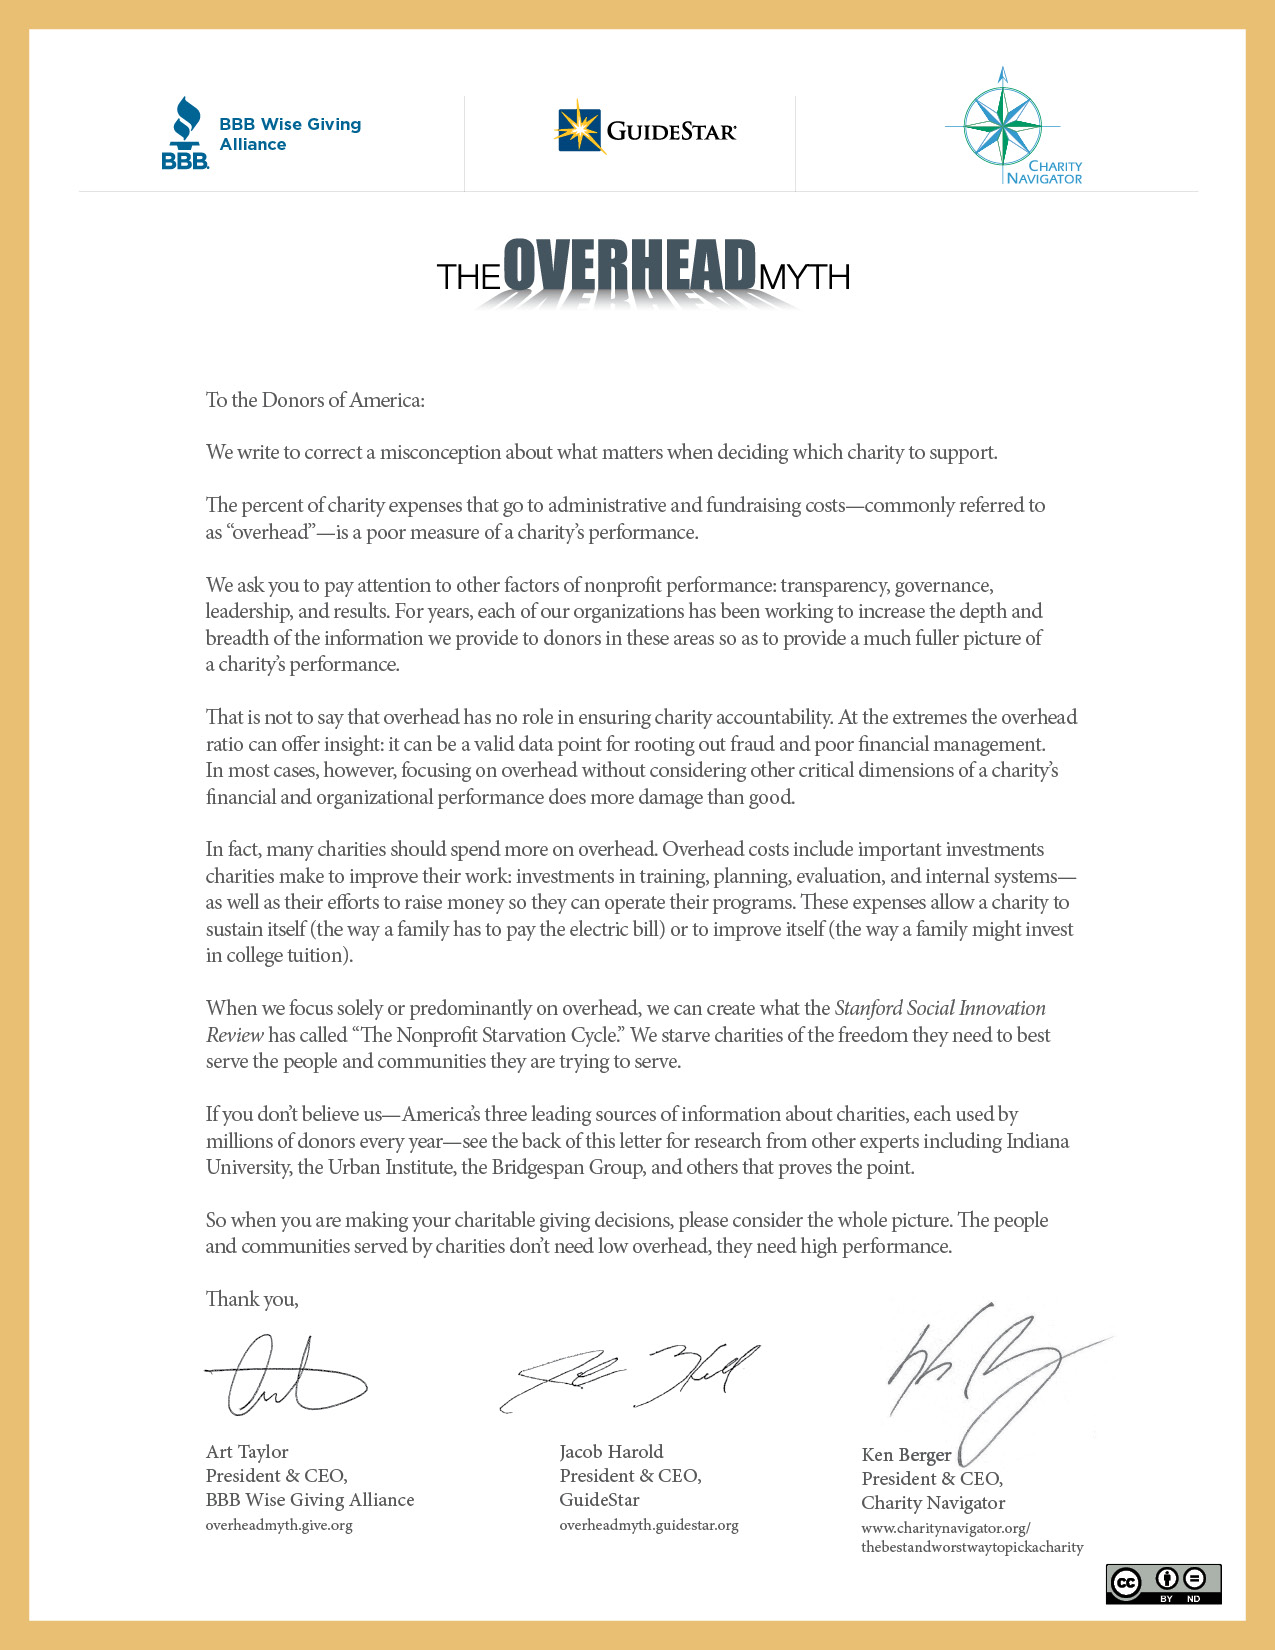
  1. The ratio of direct program services to core mission support (90%/10%).  Although the field has changed considerably in the last few years with the efforts of GuideStar and others to correct ill-informed perceptions about nonprofit overhead, there are still donors want to know how much of our budget is comprised of Fundraising and G&A – and we want to make it easy for them to see and understand that ratio.
  2. How much of our full budget we dedicate to each of the mission-driven programs we offer (62%/26%/12%). Note that these percentages include a pro-rated portion of the core mission support expenses.  Since we’ve already called out the ratio of direct and support costs, we are able to separately look at the full cost of our programs, showing how much of the pie we dedicate to each totaling 100%.

This approach requires a little bit of design work, as it’s not a stock Excel chart.  And the standard pie chart for program-centered expenses certainly gets the job done well (and far better than with any other type of budget).  But this strikes me as an exciting way to take our expense infographics to the next level.

In Summary

As this is the last installment, let’s wrap it up with some key take-aways from the entire four-part series.

  • Great budgets simultaneously give trustees and staff the insights and understanding they need make mission-driven strategic decisions and inspire donors, program partners, and other constituents to understand and engage with our organizations.
  • Functional and departmental budgets don’t allow us to tell our story well.
  • Program-centered budgets allow us to clearly convey what do we do/accomplish, how much it costs, and where the funding comes from.
  • We get to name our revenue and expense lines however we like, and we can pick the wording that best expresses what we value and accomplish.
  • It is imperative that we allocated shared costs.  Not doing so dramatically overstates G&A, which makes many nonprofits look like they’re spending more on G&A than they are and than the norm– and likewise understates the cost of our program services, which prevents us from having the accurate information we need to make thoughtful, strategic decisions about our organization’s priorities, activities, and future.
  • Once we have a well-organized program-centered budget with intentional and evocative naming and allocated shared costs, we are able to present budget tables and infographics that tell our story clearly and compellingly.  (The ones in this fourth installment and, of course, many more – depending on what elements of our story we want to emphasize.

Thanks for coming on this budgety journey with me.  I get pretty geekishly excited about great budgets – so if you create or already have a program-centered budget for your organization that you like, please share it with me at the email address below.  I’d love to see it.

SHOW ME YOUR BUDGET (Part III): A Multi-Part Series on Great Nonprofit Budgets

This is the third in a series of posts about creating and utilizing a great program-centered budget.  Click here to read Part I: Choosing to Create a Program-Centered Budget.  Click here to read Part II:  Choosing the Right Revenue and Expense Lines (and Naming Them Well).

Introduction

“Don’t tell me what you value; show me your budget, and I’ll tell you what you value.”

A nonprofit’s annual budget has the capacity to be the most important communication tool the organization has – both internally and externally.  A clear and purposeful budget can simultaneously provide trustees and staff the insights and understanding they need make mission-driven strategic decisions and inspire donors, program partners, and other constituents to engage with the organization.  

A great budget tells a story about what we value – every bit as much as a great speech, brochure, website, or solicitation.  When we develop a budget, it’s our obligation, and a great opportunity, to tell that story intentionally and directly – and (importantly) in a way that doesn’t make most readers feel like they’re reading a foreign language.  I believe that the most compelling and effective way to do just that is through a “Program-Centered Budget.” 

* * * * *

Part III: Allocating Shared Cost

This is the third installment in a four-part series of posts about creating and utilizing a great program-centered budget.  In Part II, Pomsky puppies helped us talk about Choosing the Right Revenue and Expense Lines and Naming Them Well.  And this installment is going to be particularly in-the-weeds.  So I’m pleased to say that adorable Chow Chow puppies will be with us this time to help keep us all awake and engaged.  (Hey, this is what works for me, no judgement.)

As we’ve discussed in both of the previous installments, a program-centered budget organizes itself around the primary programs (mission-focused activities) that the organization offers or undertakes.  All shared expenses, from office supplies up to the chief executive’s salary, are allocated to either (1) one of the organization’s core programs/activities; (2) fundraising costs; or (3) G&A.  So, let’s look how to accurately and efficiently allocate these cost in a way that fully adheres to Generally Accepted Accounting Principles (GAAP).

96


Normal
0


false
false
false

EN-US
X-NONE
X-NONE


 <w:LatentStyles DefLockedState="false" DefUnhideWhenUsed="false"
DefSemiHidden="false" DefQFormat="false" DefPriority="99"
LatentStyleCount…

Chow Chow Puppy Says: “Wait, what?! GAAP? Cost allocations?  I have to tell you, I’m already feeling really overwhelmed by this piece.”

I appreciate you letting me know, Chow Chow Puppy.  And I’ll tell you the truth – if you’re feeling that way, it’s totally ok for you to wait for (jump to) the fourth and final installment in the series, when we wrap everything up and talk a little about how we present our budget materials.  This is going to be a wonkier-than-usual post as it explores the mechanics of cost allocation.  And, though the ideas that follow absolutely don’t require any formal financial training, they are probably going to be of most interest to financial staff and Finance Committee members.

Two Problems with Over-Booking G&A

Some organizations simply book all (or an unnecessarily large portion of) shared costs as G&A.  This causes two meaningful problems.  

First, it leads to dramatically overstating G&A on audited financials and the IRS-990.  Although the field has changed considerably in the last few years with the efforts of GuideStar and others to correct ill-informed perceptions about nonprofit overhead, donors still look at how much our organizations spend on G&A as a percentage of the total budget.  So it’s important that we let donors compare apples to apples – by fully allocating shared costs, at the maximum level allowed by GAAP, so that the costs ultimately presented as G&A are accurate.

Even more damaging, in my opinion, it also dramatically understates the cost of our programs.  It is imperative that staff and board leadership understand the full and true cost of all of the programs we undertake to achieve our mission.  When we understate the cost of programs (by not including shared costs that are essential to executing the programs), we don’t have the accurate information we need to make thoughtful, strategic decisions about our organization’s priorities, activities, and future.  Understating the true “philanthropic investment” required for each program (the full cost, less direct program revenue) also has a serious negative effect on our ability to effectively raise money, particularly major gifts.

Assumption of Departments

This piece will assume that our organization: 1) has departments and departmental budgets, and tracks expenses accordingly; 2) has three core programs, each of which has its own department; and 3) that our list of departments is as follows:

  • Program Department #1
  • Program Department #2
  • Program Department #3
  • Facilities
  • I.T.
  • Office Management
  • Human Resources
  • Finance
  • Marketing
  • Design
  • Fundraising/Development

I understand that it’s unlikely that your real organization has this exact set-up.  But these assumptions will allow us to explore the fundamental considerations when allocating shared costs – which should allow you to extrapolate and make the necessary adjustments and judgment calls as you apply the principles to your own structure and finances.

Order Matters for Booking Allocations

We are going to look at four categories of allocation – and order matters. 

  1. Allocation of salaries comes first. 
  2. Then we allocate costs related to facilities. 
  3. Then we allocate shared administrative costs. 
  4. Then we allocate shared non-administrative costs.

With the exceptions of salaries, all allocations are made through journal adjustments – and are generally booked either monthly or quarterly, depending on how often you prepare financial statements for staff (and board) leadership.  

96


Normal
0


false
false
false

EN-US
X-NONE
X-NONE


 <w:LatentStyles DefLockedState="false" DefUnhideWhenUsed="false"
DefSemiHidden="false" DefQFormat="false" DefPriority="99"
LatentStyleCount…

Chow Chow Puppy Says: “Excellent.  As a nonprofit financial professional puppy, I’m excited to dive into the considerations for each of the four categories of allocation.  Let’s do this!”

Allocation One: Salaries (including withholdings, taxes, benefits, etc.)

Employees fit into one of two categories: either they dedicate 100% of their time to one department or their time is divided between multiple departments. 

If employees dedicate 100% of their time to one department, then they’re all set and no allocation is needed.  (Note that we’re talking about departments, not programs, and that can make a difference as we’re thinking this through.  For example, a full-time graphic designer would be designated as 100% to the Design department.  As part of her/his work in the Design department, that designer works on projects for multiple other departments/programs.  But we’ll address that use of her/his time when we allocate the design department in Allocation Four.  This is a good example of why the order of allocation matters.)

For employees who divide their time between multiple departments, the employee and the supervisor should work together to assess how their time is divided over the course of a full year.  Often, this articulated division of a staff member’s time is explicit in an employee’s job description.  (If it isn’t, this is something worth adding to the job description as soon as you’ve determined the division.)  There is no need to create a timesheet or tracking system for this allocation, as that often takes far more time than the value added – though occasional check-ins to assess whether allocations still feel accurate are beneficial.  Executive (and Artistic) Directors almost always dedicate their time to the work of multiple departments.  And it’s critical that staff leaders’ time be allocated accurately.  Beyond those leaders, organizations vary.  Some have a fair number of employees who split their time between multiple departments; some have almost none.  An example of an assessment could look like the following:

In most cases, the distribution of an employee’s salary and related costs to the appropriate departments is best accomplished through the payroll system itself.  Almost any payroll system/vendor allows you to create departments into which you book staff costs.  Many systems, in fact, require it.  Once you have your percentages from the analysis above, simply use those percentages for each employee.  Booking staff costs to the appropriate departments then happens automatically as part of our standard, recurring payroll booking/reconciliation.

Allocation Two: Facilities Related Costs

Square footage is the basis for allocation most commonly used for the Facilities department.  This includes all costs related to facilities – staffing, rents, care and maintenance, etc.  (It also includes depreciation, unless your organization tracks depreciation below the line.)  This is accomplished by documenting the square footage each department uses – including all program, office, and other spaces.  If a space is used by multiple departments, then we assess how much each department uses the space compared to the other(s), and split the square footage accordingly.  This analysis will ultimately lead us to a table along the lines of the following:

From here, we allocate all costs in the Facilities department to the other departments, using the percentages we determined.  In the sample above, you’ll note that, once we do this, we’ll have allocated out 98% of Facilities costs.  The remaining 2% is essentially the Facilities Manager’s office.

96


Normal
0


false
false
false

EN-US
X-NONE
X-NONE


 <w:LatentStyles DefLockedState="false" DefUnhideWhenUsed="false"
DefSemiHidden="false" DefQFormat="false" DefPriority="99"
LatentStyleCount…

Chow Chow Puppies Say: “We run the Finance, HR, and IT Departments, respectively.  How are our costs allocated?”

Allocation Three: Shared Administrative Costs

Looking at our sample organization, the “administrative” departments are Finance, Human Resources, I.T., and Office Management.  The most common basis for allocation for administrative functions is FTE (the number of full-time-equivalent employees in each department).  Much of the work of these departments tends to be driven by employees themselves – such as Finance managing payroll, Human Resources managing performance reviews, Office Management making sure that all employees have the supplies they need, I.T. supporting individual equipment and support needs, etc.  In most cases, the remaining functions also tend to correlate well to the number of FTEs.  (If there were a specific reason that an administrative department did not follow this norm, financial and executive leadership at the organization would want to look at the reality of how the department’s resources are utilized and adjust accordingly.)  Because we’ve already set up the salary/employee allocation, our payroll system/vendor will provide everything we need for us to do our FTE analysis, making it pretty easy for us to put something together along the lines of the following:

We then allocate all costs from each department (Finance, Human Resources, I.T., and Office Management) to the other departments, using the percentages we determined.  As with Facilities, most (but not 100%) of the costs are ultimately allocated out, away from the administrative departments themselves.  Which makes sense, as most of the work of these departments is to support the employees and activities of other departments, with only a small amount of time dedicated to supporting their own payroll, I.T, etc.

Grouping the Administrative Departments into G&A  

Once Allocation Three has been completed for each of the four administrative departments (Finance, Human Resources, I.T., and Office Management), the four departments should be grouped together as G&A – as audited financials and the IRS-990 will ask us to present all expenses as either Program Services, Fundraising, or G&A.  (Many organizations will already have this grouping in how they’ve set up their financial systems and reporting, with those four departments listed as sub-categories of G&A.) 

Allocation Four: Shared Non-Administrative Costs

Looking at our sample organization, the “non-administrative” departments are Marketing & Design.  100% of the costs in these two departments will ultimately be allocated out to a specific program department or fundraising (or, on rare occasions, to G&A*).  For these two departments, subjective assessment is the most common and effective basis for allocation.  Department leaders should examine both our hard-cost spending and the activities of our employees to develop an assessment of how much of total departmental resources are utilized for each program department – and for fundraising, if there is any direct service to the Development department.  The assessment will ultimately lead us to tables along the lines of the following: 

96


Normal
0


false
false
false

EN-US
X-NONE
X-NONE


 <w:LatentStyles DefLockedState="false" DefUnhideWhenUsed="false"
DefSemiHidden="false" DefQFormat="false" DefPriority="99"
LatentStyleCount…

*It is rare for shared non-administrative costs to be allocated out G&A, but not completely unheard of.  For example, there could be instances where a Design department did work for an administrative department – perhaps creating a new design for checks that the Finance Department uses.  Often, even when this happen, so little time is spent that it’s not worth incorporating an allocation.  However, if enough of such work happens that external auditors might find it “material,” then a percentage for G&A should be included in a table like the one above.  If that happens, finance staff would need to create a system for making that allocation before Allocation Three happens, and for addressing any circular formulas that arise from the process.

Similar to the staff-focus analysis in Allocation One, it is beneficial to conduct check-ins to assess whether the allocations still feel accurate, with a particularly in-depth review at the end of the fiscal year – and to adjust the allocations accordingly.

Conclusion

Those are all four of the steps needed to appropriately allocated shared costs.  All of our costs now are booked to one of our core programs, to fundraising, or to G&A – giving us accurate clear and accurate information about how much we spend on each program, fundraising, and G&A. 

96


Normal
0


false
false
false

EN-US
X-NONE
X-NONE


 <w:LatentStyles DefLockedState="false" DefUnhideWhenUsed="false"
DefSemiHidden="false" DefQFormat="false" DefPriority="99"
LatentStyleCount…

Chow Chow Puppy Says: “Nice.  Thanks.  I’m going to start right n… Squirrel!  Squirrel!  Squirrel!”

Ok.  Bye, Chow Chow Puppy. 

Thanks for listening.  In the next and final installment of this series (Part IV), we’ll wrap everything up and talk about how we present our budget materials.

SHOW ME YOUR BUDGET (Part II): A Multi-Part Series on Great Nonprofit Budgets

This is the second in a series of posts about creating and utilizing a great program-centered budget.  Click here for a link to the first.

Introduction

“Don’t tell me what you value; show me your budget, and I’ll tell you what you value.”

A nonprofit’s annual budget has the capacity to be the most important communication tool the organization has – both internally and externally.  A clear and purposeful budget can simultaneously provide trustees and staff the insights and understanding they need make mission-driven strategic decisions and inspire donors, program partners, and other constituents to engage with the organization.  

A great budget tells a story about what we value – every bit as much as a great speech, brochure, website, or solicitation.  When we develop a budget, it’s our obligation, and a great opportunity, to tell that story intentionally and directly – and (importantly) in a way that doesn’t make most readers feel like they’re reading a foreign language.  I believe that the most compelling and effective way to do just that is through a “Program-Centered Budget.” 

* * * * *

Part II:  Choosing the Right Revenue and Expense Lines
(and Naming Them Well)

I’ll be frank and share that, as I wrote the very-dry and very-in-the-weeds beginnings of this second post in the series, I almost deleted post #1 and scrapped this whole idea – worried that a more boring title and topic would be hard to find.  But I do think that this topic is important, so I’ve decided to dig in.  That said, it seems advantageous to keep us all engaged with photos of a puppy I think is basically irrisistable -  a Pomeranian/Husky mix - THE POMSKY.  You’re welcome. 

Pomsky Puppy Asks: “What are some things to consider when naming revenue and expense lines on a nonprofit budget?”

Pomsky Puppy Asks: “What are some things to consider when naming revenue and expense lines on a nonprofit budget?”

Thanks, for asking, Pomsky Puppy.  

Let’s look at expense and revenue lines for the Summary Budget – the top-level budget that is most frequently reviewed by the full board and most frequently shared when a donor or other external constituent is shown our budget.  (This is also the budget that tends to tie most directly to our annual Audited Financials.)

Quick Recap: Program-Centered Budgeting Part I

A Program-Centered Budget organizes itself around the primary programs (mission-focused activities) that the organization offers or undertakes.  All shared expenses, from office supplies up to the chief executive’s salary, are allocated to either (1) one of the organization’s core programs/activities; (2) fundraising costs; or (3) G&A.  Click here to review "Choosing to Create a Program-Centered Budget."

Expense Lines in the Summary Budget

We’ll always want to include independent line-items for Fundraising and G&A, which is pro forma – expected on any budget.  (In the future installment about allocations, we’ll talk about not “over-counting” either of these – something that happens a lot.)  For the other top-level expense lines, this is where we want to think about what we’re trying to communicate – what is the story we’re telling. The right expense-line names will be driven by our specific mission, constituency/community, strategic priorities, etc.  By choosing a Program-Centered Budget, we’ve already agreed that the “core programs” will be our expense lines.  But we have good story-telling decisions to make about how we present our core programs (what do we consolidate and what do we break out) and what language we choose to make our story as evocative and compelling as possible.

Let’s use an example of a theatre company that already utilizes a Program-Centered Budget.  (It’s from a real organization that has it’s financials online; for our purposes, I’m changing their name to ABC Theatre.)  They present their expenses as follows:

For all of the reasons outlined in Part I of this series, this approach is already much better than a Departmental or Functional budget.  Q: What does the organization do? A: Performances and Education.  But there are opportunities to break out and rename the program services that would tell both internal and external readers more about what the organizations values and accomplishes.  Consider this alternative to this same budget:

We know much more about Theatre X from this presentation of the same bottom-line expense numbers.  We know that they have two stages, one of which is primarily about experimentation.  We know that they spend a lot more on main stage productions than they do on their experimental stage, but that they are still committing serious funding to experiential theatre.  And we know that they have two primary types of educational programs – bringing students to the theatre for productions and going into classrooms to do work with children at school. 

Or we can consider a different focus for the theatre...

Once again, the way they break out the expense lines (vs. just "Performances and Education" tells us a lot about the mission, focus, and work of this version of ABC Theatre. We know that they do two basic kinds of theatre – Shakespeare & Classical and New Work. Going deeper, we also know that they are doing “world-class” Shakespeare and Classical theatre, which tells us something about the level of actors, directors, designers, and full-productions audiences experience. We know that they spend almost as much money on development and production of New Work as they do on Shakespeare and Classical work.  The name of their new work program, "Vibrant Voices," gives us a some insight about the focus and aspiration of the new work they create, and we know know that they invest in both production of new work and development of new work (presumably with the possibility of it being produced in future years).  We know the primary focus and purpose of their education programs is to explore social justice through theatre – as opposed to other purposes such programs might have, such as gaining confidence, building teamwork skills, developing a general appreciation for theatre, etc.  (Many organizations already have excellent and evocative names for their programs that can be placed directly into their budgets.  If you have an evocative name, it's almost always a good idea to use it.)  For all three of the expense lines under “program services,” we are given a sense of what they’re trying to accomplish, why it matters, and implicitly why it’s worth supporting philanthropically.

Pomsky Puppies say: “But Sean, we don’t work at a theatre.&nbsp; We work at a museum, a social service organization, a conservation organization, a hospital, a social justice organization, and a homeless shelter – respectively.&nbsp; What about us?”

Pomsky Puppies say: “But Sean, we don’t work at a theatre.  We work at a museum, a social service organization, a conservation organization, a hospital, a social justice organization, and a homeless shelter – respectively.  What about us?”

Don’t worry, Pomsky Puppies.  This approach works for all of you.  No matter what the purpose of your nonprofit, you all exist to serve your community and/or constituents.  You all exist solely to create public benefit.  Whatever core programs you offer to create that benefit, those are your expense lines – and you can follow the considerations laid out in our theatre example above to help develop the clearest and most evocative way to categorize and describe those programs.

Revenue Lines in the Summary Budget

Big picture, we want people to look at the revenue section of our budget and have a clear understanding of where the money comes from to fund our work to achieve our mission (as articulated in the expense section of the budget).  Most of the work to create an evocative and compelling message comes on the expense side, so there is less work needed for revenue lines to get the “poetry” of the language right.  But we still have opportunities to decide what we want to communicate, and why.  A straightforward (minimalistic) approach could look like:

But, like expenses, we can break things out in a way that conveys what we want people to know (what we think it’s important to track on this highest-level budget).  You’ll note that in all of the following examples, what is called out is telling about the organization’s focus and priorities.

All three alternatives show valid approaches.  It’s all about what the organization values and wants to convey – perhaps to correct a misperception, perhaps to reinforce something positive that is already generally accepted, perhaps to call-out something we’re working to change over time.  (Note: Looking at Alternative C, there should be a really good reason that you’re calling out restricted/designated gifts.  But that’s my inclination based on my approach to development; the point is, you know your organization best, and the lines need to reflect your priorities.)  The important thing is to make the naming clear, thoughtful, and intentional.

Detailed (Second-Level) Budgets

Of course, behind every line on the Summary Budget is a great deal of supporting detail on a second-level Detailed Budget.  Even on those sub-budgets, think about how you’re naming each revenue and expense line.  How are you tracking and telling the financial story of each core program and each source of revenue?

Pomsky Puppy Says: “Thanks, Sean.&nbsp; I can’t wait to start trying this. &nbsp;It's great to think of our budget as a tool in our communications arsenal.&nbsp; It’s going to be thought-provoking and engaging to look at how we can match our budget-…

Pomsky Puppy Says: “Thanks, Sean.  I can’t wait to start trying this.  It's great to think of our budget as a tool in our communications arsenal.  It’s going to be thought-provoking and engaging to look at how we can match our budget-line naming to our core purpose and compelling messaging.”

Well thank you for saying that, Pomsky Puppy.  I think you’ll be happy with how this develops. 

In the next installment of this series (Part III), we’ll take an in-depth look at how to analyze and allocate shared expenses.  Additional baby animal photos will be needed. 


SHOW ME YOUR BUDGET (Part I): A Multi-Part Series on Great Nonprofit Budgets

Part I:  Choosing to Create a Program-Centered Budget

“Don’t tell me what you value; show me your budget, and I’ll tell you what you value.” 

A nonprofit’s annual budget has the capacity to be the most important communication tool the organization has – both internally and externally. A clear and purposeful budget can simultaneously provide trustees and staff the insights and understanding they need make mission-driven strategic decisions and inspire donors, program partners, and other constituents to engage with the organization.  

A great budget tells a story (about what we value) – every bit as much as a great speech, brochure, website, or solicitation.  When we develop a budget, it’s our obligation, and a great opportunity, to tell that story intentionally and directly – and (importantly) in a way that doesn’t make most readers feel like they’re reading a foreign language.  I believe that the most compelling and effective way to do just that is through a “Program-Centered Budget.” 

This is the first in a series of posts about creating and utilizing a great program-centered budget.  To start:

What is a Program-Centered Budget (and what are the alternatives)?

The line-items of a budget are the heart of the story we’re trying to tell.  What do we spend money on? And where does that money come from? 

Let’s look together at the same budget, for a generic nonprofit with unnamed programs, as it would be presented using three broad types of budgets: program-centered, functional, and departmental.  The fundamental difference between the three budget types relates to how expenses are organized and presented, so the comparison will focus solely on expenses.  (Presentation of revenue is also an important element of great budgeting and will be discussed in later posts, when we get into the steps and considerations that go into creating a compelling program-centered budget.)

A Program-Centered Budget is one that organizes itself around the primary programs (mission-focused activities) that the organization offers or undertakes.  All shared expenses, from office supplies up to the chief executive’s salary, are allocated to either (1) one of the organization’s core programs/activities; (2) fundraising costs; or (3) G&A.  Once those allocations have been calculated (something we’ll walk through step-by-step in later posts), expenses for a generic program-centered budget would be structured as follows:

It is exciting and powerfully easy to look at a Program-Centered Budget and clearly understand what our organization actually does (the core programs) and how much we spend on each of our programs/activities. 

A Functional Budget is on the other side of the budgetary spectrum; it organizes expenses by functional purchases and activities. Expenses for a generic functional budget would be structured as follows:

An understanding of functional expenses certainly matters, and is one of the building blocks of good financial management; it is important to understand how much our organizations pay in total salaries, or total advertising, or even total paper clips.  But tracking functional expenses is not a meaningful purpose for an annual budget.  A functional budget does not convey what we value.  In the functional budget above, for example, we know that we spend more on salaries than anything else.  But we have no understanding of what those salaries are invested in (what programs and activities those employees spend their time executing).  The same thing goes for contract services, royalties, advertising, etc.  Organizations with wildly different programs and priorities could have nearly identical functional budgets.  So, unlike a program-centered budget, a functional budget offers very little in the way of insights and understanding to help board and staff leaders make mission-driven strategic decisions, and offers even less that could inspire donors, program partners, or other constituents to engage with the organization.

Apologies for getting a little tax-wonky here for a second, but... In talking with organizations that use a functional budget, many shared that they do so because it matches the Functional Expenses section in the annual filing document for nonprofits – IRS Form 990, Section IX.  (A few even said that they thought they were required to budget that way, and were pleased to learn that they are not.)  As noted above, it’s important to have an understanding of functional expenses as part of good financial management – and functional expense information is needed for the IRS-990.  But the IRS-990 requires that we track and document a considerable amount of information on a variety of topics, far more than any organization I know endeavors to put into their annual budget.  In addition, even if one wanted to be guided by Section IX of IRS-990, that section isn’t as simplistic as organizing a budget by functional expenses alone.  The expense rows on the form are functional, but there are multiple columns next to each line.  On the IRS-990, we have to allocate each functional expense line to either “Program service expense,” “Management and general expense,” or “Fundraising expense.”  The IRS-990 asks us to consolidate all programs into one column (instead of tracking expenses by multiple programs), but other than that consolidation, the form’s required columns are exactly the line-items that are used in the program-centered budget example above.  In other words, the IRS requires that we track and document expenses both ways, organized functionally and by program.  So it is entirely up to us to decide which approach will serve us best in the annual budget we use for internal and external communication.

Finally, a Departmental Budget offers a hybrid approach; it organizes expenses based on the operating departments an organization has defined internally.  Expenses for a generic departmental budget would be structured as follows:

This is probably the most common budget type. Its efficacy as a governance, management, and communication tool is all over the place, because so much depends on how the organization’s staff leadership and departments are structured.  Departmental budgets are usually more effective than functional budgets (at least salaries and contract services are allocated to the various departments, instead of being listed as a lump sum).  That said, they are generally considerably less effective than program-centered budgets, as so many support activities are grouped by function rather than connected to the program they are supporting.  For example, in the departmental budget above, we know that the organization’s marketing department has a budget of $400,000 – but we don’t know how much of the department’s time and efforts are dedicated to each of the organization’s core programs/activities.  Perhaps one program requires 60% of the budget and another program has no marketing whatsoever.  In this departmental budget, we have no way to see how the marketing costs are (or are not) tied to each program.  As a result, we are not conveying the full cost of each program/activity.  We’re not telling our story – to ourselves or to our supporters.  All of the other departmental line-items (e.g. Design, IT, the Executive Director’s salary… everything but the core program/activity lines) present the same obstacle to our ability to see full costs and a clear story. 

This is why a Program-Centered Budget is far and away the best tool at our disposal – for both management and communications purposes.  As described earlier, in a program centered budget, all shared expenses (all expenses that are not already categorized as direct expenses for each core program/activity) are allocated to one of the organization’s core programs – or to fundraising costs or G&A.  This allows us to convey the full cost of each program.  It allows us to clearly tell (the expense side of) our story – “this is what we do, and this is what is costs to do it.” 


Upcoming entries in this series will dive into how to create a great program-centered budget, step by step, and then how to best utilize it. 

UP NEXT
Part II of SHOW ME YOUR BUDGET:
Choosing the Right Revenue and Expense Lines (and Naming Them Well)


Beware the Overhead Myth

With “Giving Tuesday” coming up tomorrow, followed by the end-of-year giving season for so many donors and nonprofits, I wanted to re-share this important joint letter from GuideStar, the Better Business Bureau, and Charity Navigator (the country’s three leading sources of information about charities), titled “The Overhead Myth.”  PLEASE take a look.

The three organizations are working to move donors away from looking at fundraising and administrative costs (or overhead) as a negative measure.  I am so grateful for these organizations’ work in this area – so thought I’d join them briefly on their noble soapbox with a little holiday-season rant, if you’ll indulge me.

Because nonprofits invest donors’ money into the choices we make to accomplish our missions, I have always felt that we have a particular and fundamental obligation to be focused, strategic, intentional, and well-managed – to work diligently to maximize the impact of every dollar raised.  Financial management and organizational focus matter.  But, although it is often used that way, “overhead percentage” is not a measure that indicates whether an organization is prudent, focused, well-managed, or has an impact.

  1. Overhead is not a bad thing – at all. Overhead is the investment a nonprofit makes in the organization-wide staff, facilities, and systems/infrastructure it needs to accomplish its mission and have an impact.

  2. Overhead is not an indicator of impact. The only indicator of impact is impact. Does the organization do work that meets a deeply meaningful need? Do its programs make a difference in people’s lives? Need, quality, reach, outcomes – those are the building blocks of impact; overhead is irrelevant in the equation.

  3. Overhead is not an indicator of the quality of management or the efficiency of the organization. It’s not an indicator of anything other than that organization’s investment in its own overall capacity to accomplish its mission. Different organizations, missions, sectors, geographic locations, and programs all require different types and levels of overhead investment. There is no magic “right percentage.” In addition, it’s worth noting that there is no consistency in what nonprofits classify as administrative and fundraising (“overhead”) expenses, as the IRS grants enormous leeway in their definitions.

  4. Overhead percentages do not indicate how much of your donation goes to the cause you’re trying to support. 100% of your donation goes to support the cause. There was an era where some nonprofits contracted with outside fundraising companies and that third-party company would keep a percentage of every donation and give the nonprofit the remainder. That era is long past, and the practice almost never happens today. But the language of that era has remained, and overhead is inaccurately being inserted into that language. For example, let’s say that a nonprofit spends 20% of its budget on overhead costs. People will sometimes look at that and say, “80% of my donation goes to support the work the organization exists to do.” Maybe they think that’s high, or maybe they think that’s low. But, either way, it’s nonsense. First, to reiterate, the overhead costs are essential to doing any meaningful work (see above), so investments in overhead are also supporting the work the nonprofit exists to do. And second, whatever the organization has determined it needs to spend on overhead in order to accomplish its mission, it has already made that decision and spent that money – whether or not you make any gift or not. Your gift has no impact on how much money is invested in overhead. Give a nonprofit $100, and they have $100 more than they did before to do the work they do to achieve their mission.

  5. In reality, far too many nonprofits spend way too little on overhead – specifically because they are afraid of people looking at them negatively for spending it. The result of avoiding overhead spending is that nonprofits perform their work more poorly, reducing their public-benefit impact and impeding their ability to achieve their mission. Here’s a stark example: at the height of the obsession with overhead percentage as a negative indicator, the New York Times discovered and reported that highly respected medical research nonprofits were having their scientists spend a substantial amount of their time writing grants, rather than working on research to cure the diseases the organizations existed to cure (research that only these scientists could perform). They did this because grant-writer salary was counted as “overhead,” and scientist salary was counted as “program” – and they felt pressured to get their overhead percentage lower, at any cost.

I’m not saying that there are no bad-apple nonprofits out there, but overhead percentages tell us nothing about whether an apple is bad or not.  If we’ve never heard of a nonprofit or are worried about whether it is legitimate, we can do a Google-search for the organization’s name and “complaints,” or “investigations,” and we’re likely to find out if there have been any potential problems.   But it’s important for us to remember that the vast, vast majority of nonprofits are completely legitimate - and using their resources well.  In my opinion, the best approach to whether nonprofits are worthy of our giving is to look at their website and materials, looking for the solid information on what they’re doing and what impact they’re having.  If their programs and impact line up with what we value, what we think is important in addressing a need/cause that matters to us, then they are good nonprofits for us.  If we aren’t moved by the work that they’re doing, then we should look for other organizations that do move us.  For information from an impartial outside source, I do recommend Guidestar, which shares solid information on programs and results, as well as financials and operations.  Overview information is available to anyone, and if you create a free account, you’ll have access to additional information and the organization's financial data in their annual IRS-990s.   If you decide you want to really dig into a 501(c)3’s financials, here's a primer: "FINDING 'THE BOTTOM LINE' IN NONPROFIT FINANCIALS".


FINDING “THE BOTTOM LINE” IN NONPROFIT FINANCIALS

I love when donors and community leaders take an interest in a nonprofit’s financials.  That kind of engagement is a tremendously good thing – for the donor, for the organization, and for the broader community.  In-depth exploration of a nonprofit’s financial statements can tell a donor so much about an organization’s priorities, sustainability, and efficiency.  The larger an organization, the more complicated the financials will likely be, and getting a thorough understanding of the financials and what they mean can be a very involved process.  But it’s worth it – particularly if you’re considering a significant investment in the organization.

That said, as excited as I happen to get about it personally, I understand that lots of people don’t share my passion for in-depth financial analysis.  (I do proudly own a t-shirt that says, “I heart spreadsheets.”) From my discussions with all types of stakeholders, I feel confident that when people say they’re looking for “the bottom line,” they mean a single number that conveys the organization’s financial performance, confirming that the organization’s operations are sustainable if it were to have that same level of revenue and expense year after year.

Sites like Charity Navigator and GuideStar have made it easier than ever for prospective donors to find financial information about nonprofit organizations.  (GuideStar, in particular, has revolutionized philanthropy by collecting and providing access to reliable information in so many areas of a nonprofit’s work – far beyond financial measures.)  But because of both sites’ reliance on IRS Form 990, neither is able to provide that single bottom-line number you want.  And problematically, on both sites, you can find a number that seems like it is the “bottom line” you’re seeking.  On Charity Navigator, it’s listed as “Excess (or Deficit) for the year,” right on the summary page.  It’s not as prominent on GuideStar, but if you print the PDF preview of the Financials Report, in the summary of the 990 information, there’s a line called “Net Gain/Loss.”  

Both numbers are Total Revenue minus Total Expenses.  Which seems logical.  It seems like Total Net Income would be that bottom line number we want.  But it’s not.  For nonprofit organizations, Total Net Income (Total Revenue minus Total Expenses) is very rarely a good indicator of an organization’s financial performance or sustainability.  In other words, the number you see on the bottom line isn’t really “the bottom line.”  This is not a new or profound insight.  I’m not breaking any ground or saying anything controversial.  Talk to any experienced nonprofit CFO or third-party auditor and they’ll agree.  (Also, none of this is meant as an indictment of Charity Navigator or GuideStar in any way.  Both organizations pull their financial data from IRS-990s, which doesn’t provide the source figures they would need to convey a more illustrative “bottom line” number.)  Rather than Total Net Income, the most useful single number to convey the bottom line for performance and sustainability is Unrestricted Net Income Before Depreciation It doesn’t roll trippingly off the tongue, but it does a much better job of telling you how a nonprofit is doing.  Here’s why (and how you find the number):

SOURCE DOCUMENT

To get the bottom-line number we want, you need a copy of an organization’s Audited Financial Statements.  Many organizations have these available on their websites, and any reputable organization will happily send you a PDF copy if you call or email them and ask.  

“UNRESTRICTED NET INCOME”

For nonprofit organizations, Unrestricted Net Income (Unrestricted Revenue minus Unrestricted Expenses) gives a far more accurate picture of activities than Total Net Income (Total Revenue minus Total Expenses).  In particular, there can be significant differences related to contributed income.

Unrestricted contributions are pretty straightforward; a donor makes a gift and tells the organization it can use it for any purpose that will help it achieve its mission.  There are two primary types of restricted contributions.  Some contributions are restricted for purpose – a donor asks that the contribution be used to fund a specific program or project.  Other contributions have “time restrictions” – a donor makes a promise (pledges) to give a certain amount of money in a future year or over several years.  Following IRS guidelines:

  • Total Revenue counts all restricted gifts in the year that they are promised, whether or not the money has been received or the restricted purpose has been accomplished. 
  • Unrestricted Revenue, on the other hand, counts restricted gifts when pledge payments are received or once an organization has released a purpose-restricted gift by doing whatever it promised to do with the funding.  


For example, let’s say that, in December of 2015, a loyal donor makes a pledge to contribute $20,000 a year for five consecutive years:

Pledge Pmt Year / Pledge Amount
          2016 / $20,000
          2017 / $20,000
          2018 / $20,000
          2019 / $20,000
          2020 / $20,000

Total Revenue will show income of $100,000 from that pledge in 2015.  All else being equal, if you accept Total Net Income as the bottom-line, it will suggest an additional $100,000 surplus that is not real – that is not reflective of the organization’s performance.  Then, for the next five years, Total Revenue from that pledge will be $0. All else being equal, if you accept Total Net Income as the bottom-line, it will suggest a $20,000 a year deficit that is not real – that is not reflective of the organization’s performance.  On the other hand, Unrestricted Revenue for that same $100,000 5-year pledge gives us a clear picture of the real situation.  In 2015, Unrestricted Revenue will be $0, since none of the gift is being received in or used for 2015 activities.  Then, for the next five years, Unrestricted Revenue will be $20,000 a year – perfectly reflecting the organization’s annual activities and performance (and matching the purpose/intent of the contribution).

Let’s say that a different donor contributes $10,000 in cash in 2015 to fund a specific program that will take place in 2016.  The problem with Total Revenue is the same.  In 2015, Total Revenue will show income of $10,000 from that restricted gift, making it look like the organization raised $10,000 more than it needed or spent.  Then, in 2016, Total Revenue will make it look as if the organization failed to raise the $10,000 it needed for that specific program.  But, once again, Unrestricted Revenue for that same $10,000 restricted gift will give us a perfect picture.  2015 Unrestricted Revenue will be $0; even though the cash was received in 2015, the restricted purpose wasn’t accomplished yet, so Unrestricted Revenue doesn’t count it.  Then, in 2016, Unrestricted Revenue will show income of $10,000, matching the organization’s actual activities and performance (and the donor’s intent).

In some cases, depending on an organization’s activities during a year, Total Net Income and Unrestricted Net Income may be very similar or even identical.  But if there is a difference, Unrestricted Net Income is the best starting point for determining a nonprofit’s real “bottom line.”

“BEFORE DEPRECIATION”

The other issue that can get in the way of understanding of a nonprofit’s bottom line is non-cash Depreciation, particularly if the organization has undergone a major construction/capital project in the last 40 years or so.

Let’s say that an organization raises $40 million through a capital campaign and builds a brand new facility (theatre, museum, shelter, etc.) to support its mission.  The new facility is completed on December 31, 2015.  The IRS requires that the cost of the new facility be spread out over its “period of usefulness,” often defined as 40 years.  So, starting in 2016, the organization would book $1 million a year in non-cash Depreciation Expense (in addition to annual operating costs associated with the new facility – maintenance, repairs, utilities, overhead, etc.)

There are logical reasons that for-profit organizations are required to book capital expenditures this way.  For example, non-cash Depreciation Expense can help for-profits more easily put aside cash for future capital costs (such as a new $40 million building 40 years later, or whatever the for-profit needs in the future).  Nonprofit capital projects, however, do not work the same way.  Donors are not generally inclined to make large contributions for an organization to put in the bank to use at some future undetermined time for some future undetermined capital project.  (Nor should they be, in my opinion.)  Nonetheless, a nonprofit in this scenario will be expensing $1 million a year in non-cash depreciation for a project they’ve already paid for and completed.  Which means that, if this nonprofit is sustainably accomplishing its mission and performing at peak efficiency, it will misleadingly have a Net Loss of $1 million every year.  If you review nonprofit financials, you’ll find that many vibrant, successful, and prudently managed nonprofits have negative Total Net Income (or even Unrestricted Net Income) year after year – due entirely to significant non-cash Depreciation Expense.

“UNRESTRICTED NET INCOME BEFORE DEPRECIATION”

To determine a nonprofit’s real bottom line, Unrestricted Net Income before Depreciation, start with Unrestricted Net Income (sometimes called Unrestricted Change in Net Assets) from the organization’s Statement of Activities in their audited financials – and simply “add back” Depreciation Expense.*  (Depreciation Expense will often be called out on the Statement of Activities.  And, if it’s not, you can always find in on the IRS-990 – page 10, line 22.)

For example, if an organization has a negative Unrestricted Net Income of ($250,000), and Depreciation Expense of $400,000 – the Unrestricted Net Income before Depreciation would be a positive $150,000.  That’s the organization’s real bottom line.

 *This approach is intended to provide an easy way to calculate a simple “bottom line” number.  The method of subtracting 100% of Depreciation Expenses is not perfect, as there are some (generally smaller) capital expenditures (e.g. computer equipment, office furniture, etc.) that may be more reasonable to think of as part of annual activities.  But the level to which depreciation can dramatically overstate expenses far outweighs the potential for understating expenses.

CONCLUSION

A nonprofit’s financials offer so much more than a single-number bottom line.  As the axiom says, “Don’t tell me what you value; show me your budget, and I’ll tell you what you value.”  The more you’re thinking about giving, the more I encourage you to spend time with an organization’s leadership to discuss its past financials and forward-looking budget. But if a quick-check-in bottom line number is what you’re looking for, Unrestricted Net Income Before Depreciation is what you want. 

Originally published February 21, 2011
Updated March 23, 2016